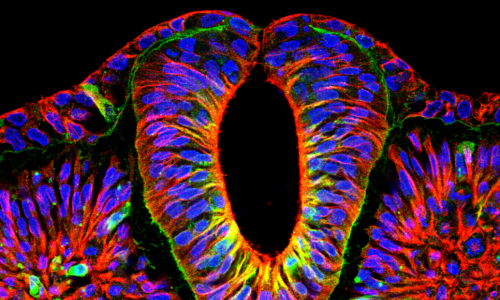
Production of human spinal-cord organoids recapitulating neural-tube morphogenesis
- published online: 28 March 2022
- Nature Biomedical Engineering, 2022, 6, pages 435–448
- doi: 10.1038/s41551-022-00868-4
Introduction
The spinal cord is a part of the central nervous system (CNS) and plays a critical role as an intermediate bridge between the brain and the body. Sensory input and motor output are exchanged through the spinal cord, and motor reflexes are performed independently of the brain. The spinal cord undergoes three major stages during embryonic development: neural plate, neural fold, and neural tube. Polarized neuroepithelial cells are induced into the neuroectoderm and condensed to form a sheet-like neural plate. The plate then neurulates to transform the neural tube; lastly, the posterior parts of the CNS become the spinal cord 1.
The developing spinal cord contains more than 20 embryonic classes of neurons. Several criteria are applied to classify neuron types, such as neurotransmitters, targets, action types, and their location during mitotic and postmitotic stages. Each neuron connects different tissues and builds a neuronal circuit that guides somatosensation and movement 2, 3. Because of this high contribution of the spinal cord, damage to the developing spinal cord can cause severe congenital disabilities such as neural tube defects (NTDs) and lead to perinatal death or lifelong disability 4. Therefore, the development and structure of the spinal cord should be studied to understand these diseases and find treatments.
Three-dimensional cultured organoids derived from hPSCs have been suggested as a new opportunity to investigate human development 5. Many studies on spinal cord diseases have been performed using animal models, but the spinal cord of humans has structurally and cellularly differences from those of other species. Moreover, access to human embryos is extremely limited because of ethical issues. hPSC-derived organoids represent human characteristics and can be easily reproduced by providing appropriate growth factors and conditions.
Several 3D cultured spinal cord organoid systems show the productivity of spinal-type neural cells, dorsoventral patterning, and 3D trunk neuromuscular connections 6. Even though spinal cord organoid systems lead to a new paradigm for studying neurodevelopmental stages, their reproducibility has some limitations, such as intra-/inter-organoid variations and batches. Since the applicability of organoids depends on how well they replicate actual spinal cell types, the distribution of neuronal cell types in organoids should be identified.
Organoids have been conventionally investigated through immunocytochemistry, which is also used to examine the presence of a specific protein on the cell surface by binding a couple of antibodies. Through this method, the structure of organoids, such as their morphological changes, can be easily identified. However, prior knowledge of the target protein must be required, and matching antibodies should be available. Since the number of fluorescence is limited, only a few protein markers can be shown at a time. Bulk RNA-seq technique has also been used in this area. Although less biased gene expression can be obtained, it only provides an average value of whole cells in the sample. The scRNA-seq technique is needed to apply to this project to investigate the heterogeneity of hSCOs. Thus, cellular composition, DEGs by cell types, and stochastic events across cells and cell types can be identified.
Some studies have confirmed that organoids in the CNS have a cell type repertoire with single-cell transcriptomic data 7. Previous studies relied on the expression of marker genes commonly used for cell type identification to classify their single-cell clusters. However, neuronal cell types are usually classified on the basis of several criteria with unclear overwrapping, and the combination of several marker genes determines known neuronal types. These marker genes are mainly composed of transcription factors and surface proteins; thus, scRNA-seq data cannot be easily detected because of the characteristics of transcriptomic analysis that takes a screenshot of the biological process in cytosolic mRNA.
Quadrato et al. 8 assigned cell types by comparing them with the human cortex in vivo data. Nevertheless, comparison analysis was performed with a log average expression of each cluster, and it was limited to hundreds of genes, which were the most informative sets for distinguishing the reported endogenous cell types of the cortex. Therefore, an unbiased and reliable method, such as comparing the overall gene expression patterns with in vivo data, should be developed to classify cells that take advantage of scRNA-seq. This part introduced a new method for producing hSCOs with a 3D structure. Experiments confirmed that this organoid recapitulated neurulation-like morphogenesis and differentiated from hPSCs to neuronal cells. Moreover, transcriptomic analysis was performed to evaluate this method; in particular, scRNA-seq data showed that various spinal cord neurons were differentiated within this organoid. A “double-checking strategy” was devised by adding a verification step to the existing method that just checked the expression of known neuron markers to increase the reliability of the cell type classification in scRNA-seq analysis. The cell clusters in our data were classified as the type with the highest similarity among reference cell types by integrating the reference and our data and then comparing the overall gene expression pattern. The assigned clusters were double-checked by the existence of the matching cell type marker expression. In summary, unbiased evaluation on hSCOs indicated that this organoid consisted of major spinal cord neuron types with dorsoventral and neurotransmitter identities. The characteristics of hSCOs, such as neurulation-like tube-forming morphogenesis and the composition of various neuron types, suggested that hSCOs represented early spinal cord development in vivo. Therefore, hSCOs might facilitate developmental studies on the human spinal cord and disease modeling associated with neural tube defects.
Results
Protocol for Generating hSCOs with Neurulation-Like Morphogenesis
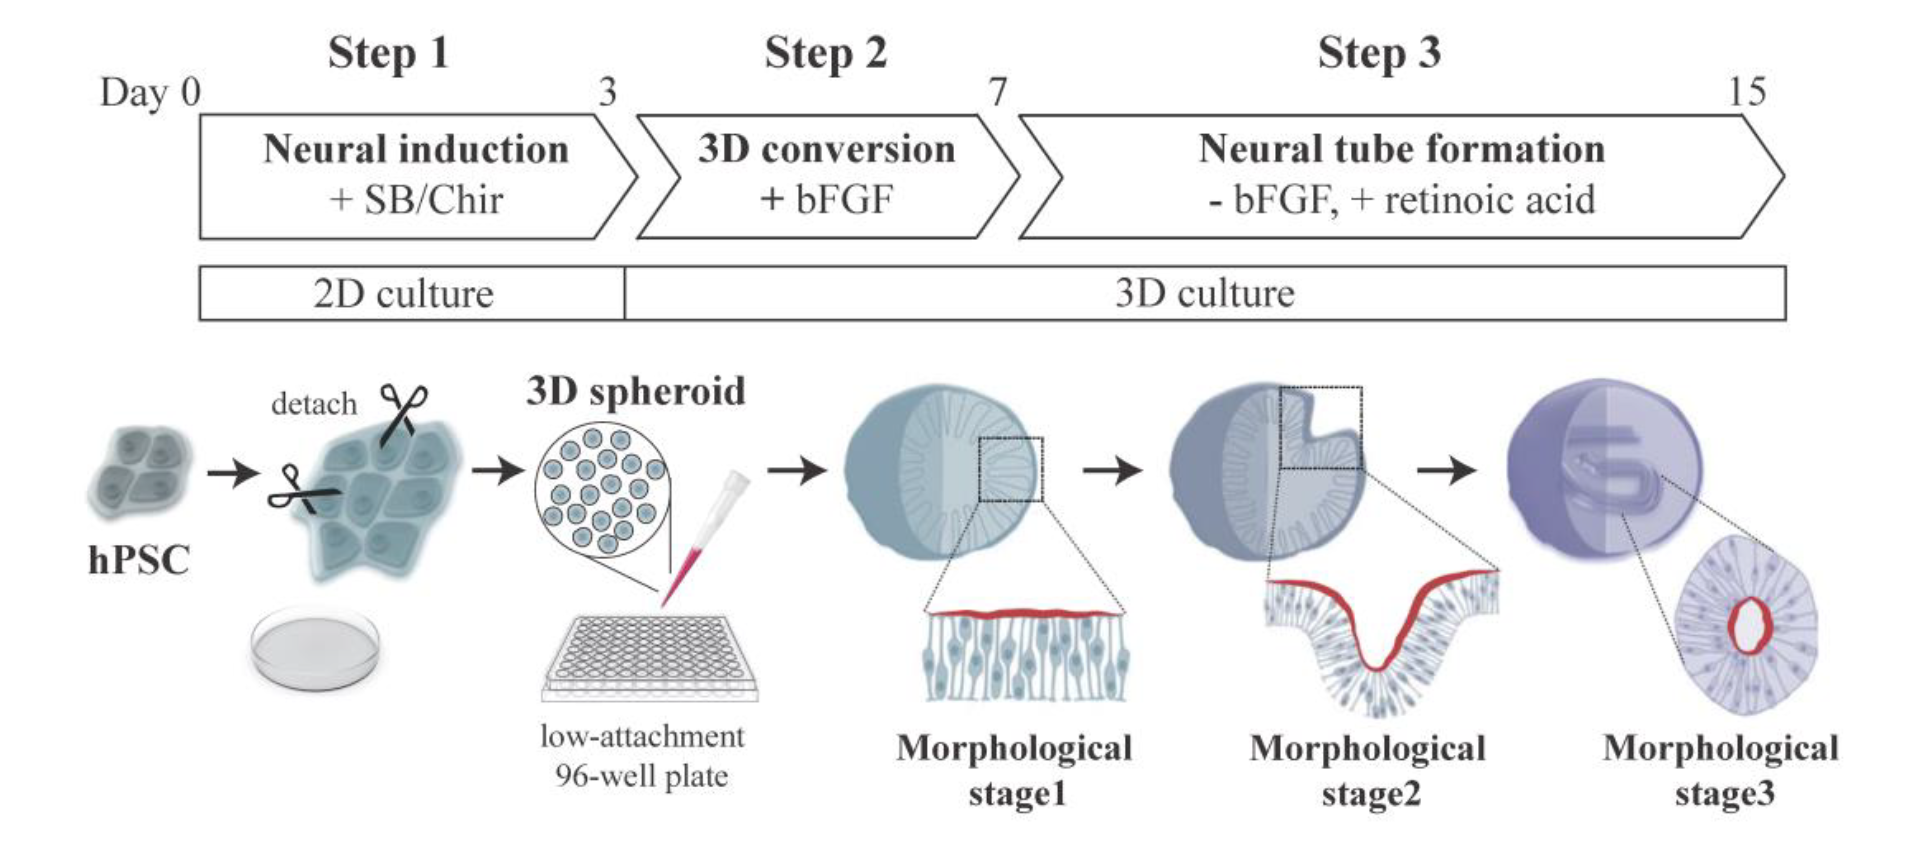 Figure 1. Schematic representation of hSCO production.
A research team from Korea University established the three-step protocol for generating hSCOs, which recapitulate early spinal cord development with neurulation-like morphogenesis (Figure 1). In Step 1, hPSCs were 2D cultured in a medium containing SB431542 (SB) and CHIR99021 (Chir) for 3 days to induce cNSCs 9. During this 2D neural induction phase, hPSCs lost their pluripotency and differentiated into cNSCs through the stage of neuro-mesodermal progenitors (NMP), similar to in vivo embryonic caudal neurogenesis 10 (Figure 2A, B). In Step 2, 2D-cultured cNSCs were smoothly detached from the dish and formed into 3D spheres, and 3D organoids were moved into a low-attachment 96-well plate and cultured in the presence of bFGF for 4 days. Through this treatment, NMP markers (Brachyury T, TBX6) were no longer expressed, and nonpolar cNSCs established a neuroepithelial (NE) layer that exhibited apical polarity similar to an embryonic neural plate (morphological stage I, Figure 2C, D). These results suggested that our induction conditions strongly guided cNMPs toward neuronal fate 9. In Step 3, the bFGF in the medium was replaced with retinoic acid (RA) to induce the morphogenic change and cell type specification. The organoids then underwent morphogenesis similar to neurulation (morphological stage II, Figure 2E-G). After tube formation was completed, the internalized neural tube elongated and showed some features, including radial alignment of cells and differentiation of neuronal cells surrounding the outside of the tube (morphological stage III, Figure 2H, I). Lastly, Y27632 was supplied to prevent further cell polarization. The 3D organoids were embedded in Matrigel to reverse the polarity of the NE and promote morphogenesis similar to neural rosette formation.
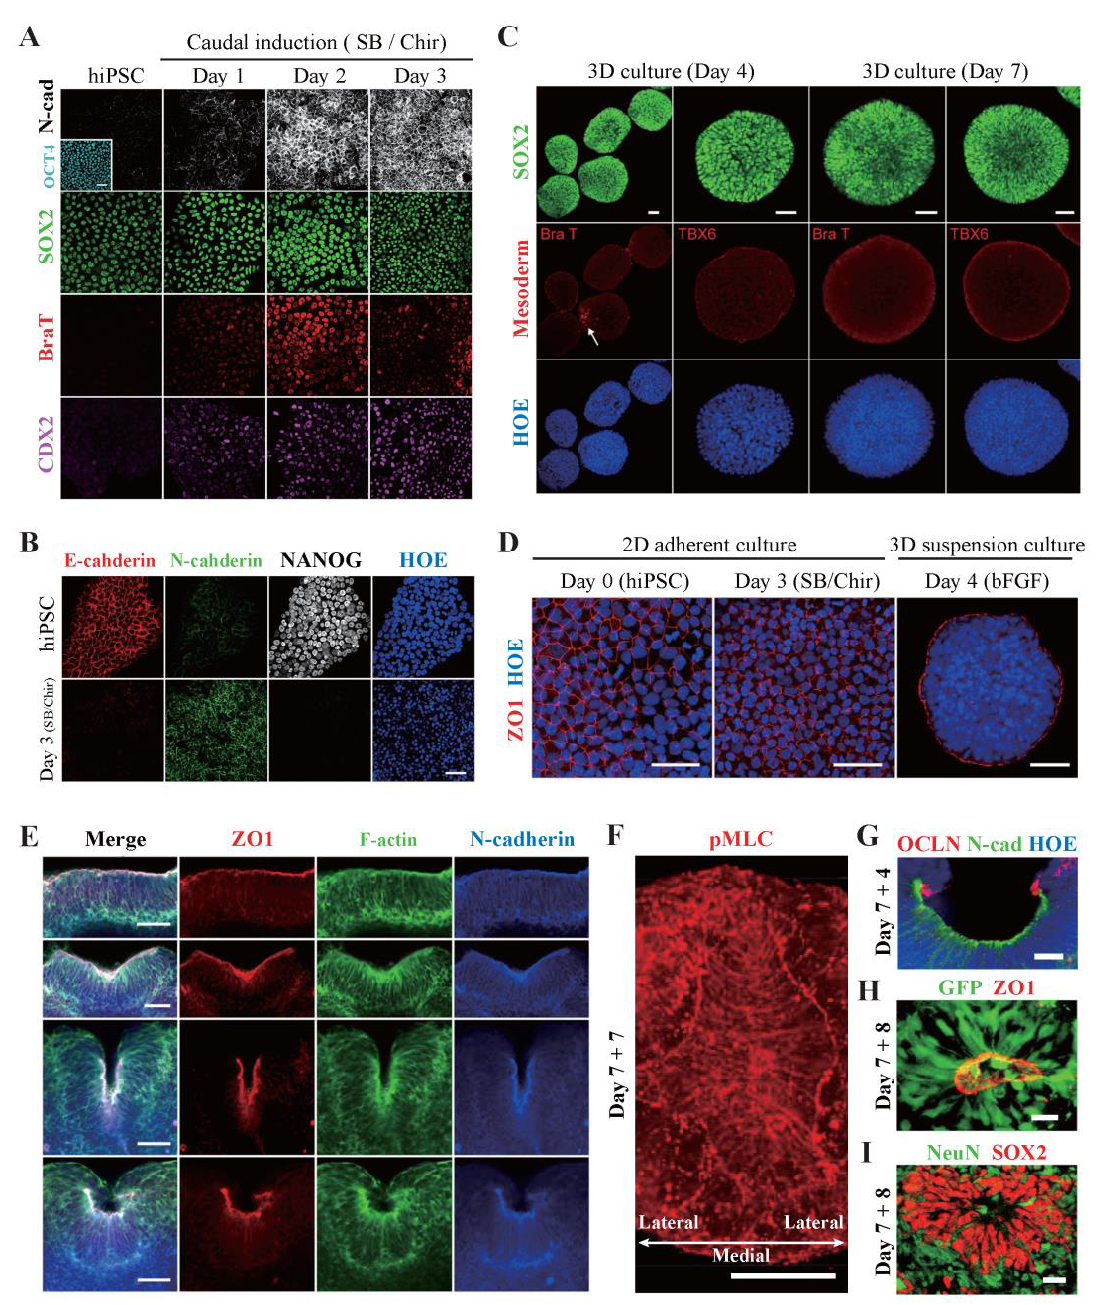 Figure 2. Immunostaining results showing that hSCOs can emulate neurulation morphogenesis.
(A) NMP markers (SOX2, Brachyury T, and CDX2) were expressed at the caudal induction stage (SB/Chir) of hiPSCs, and N-cad was subsequently expressed, suggesting that hiPSCs were converted into neural stem cells. (B) Non-neuronal epithelial cells (E-cadherin, red) were converted into NE cells (N-cadherin, green) at the 2D induction stage. At the same time, hiPSCs lost their pluripotency as confirmed by NANOG expression. Nuclei were counterstained with Hoechst (blue). (C) 3D organoids were completely induced into the neural fate. Although a small number of organoids expressed BraT at the early stage of 3D culture (day 4), they disappeared (day 7), and the expression of any other NMP markers, including TBX6, was not found. (D) During the 3D conversion stage, NE cells (ZO1, red) re-established their polarity within 24 h. (E) Neurulation-like morphological changes at various stages of hCSOs. (F) Bird’s eye view of the planar cell polarity of NE cells (pMLC, red) during fold formation. (G) The apical side of fold. NE cells (N-cadherin, green) were aligned along the surface. Notably, OCCLUDIN (OCLN, red) localized at the dorsal tip of the fold. (H) Morphological characteristics of NE cells in the neural tube. (I) NSCs (SOX2, red) and neurons (NeuN, green) radially surrounded the tube. Scale bars, A–E: 50 μm, F–I: 20 μm.
Microarray Data of Organoid Maturation
After the morphogenesis period, the maturation progress of hSCOs was explored using an unbiased manner. Four samples of microarray data were collected during the continuous growth period up to 6 months from the moment organoids were completed. For comparison with these data, human fetal spinal cord tissue in gestational week 18 was also obtained. A total of 1,556 variable genes were selected (Figure 3A) to focus on genes that changed with cellular differentiation toward spinal cord development in hSCO samples. Hierarchical cluster analysis showed that these variable genes were divided into two clusters according to organoid maturation: upregulated genes (Cluster 2) and downregulated genes (Cluster 1). Investigations into the function of these gene clusters showed that neural stem cell proliferation and patterning-related genes were mainly expressed at the early stage of hSCOs, whereas maturation-related genes, such as neurogenesis and gliogenesis, were upregulated at the late stage. These results indicated that NSCs of hSCOs differentiated into neurons over time. Moreover, hierarchically, matured hSCOs became similar to the developing fetal spinal cord tissue.
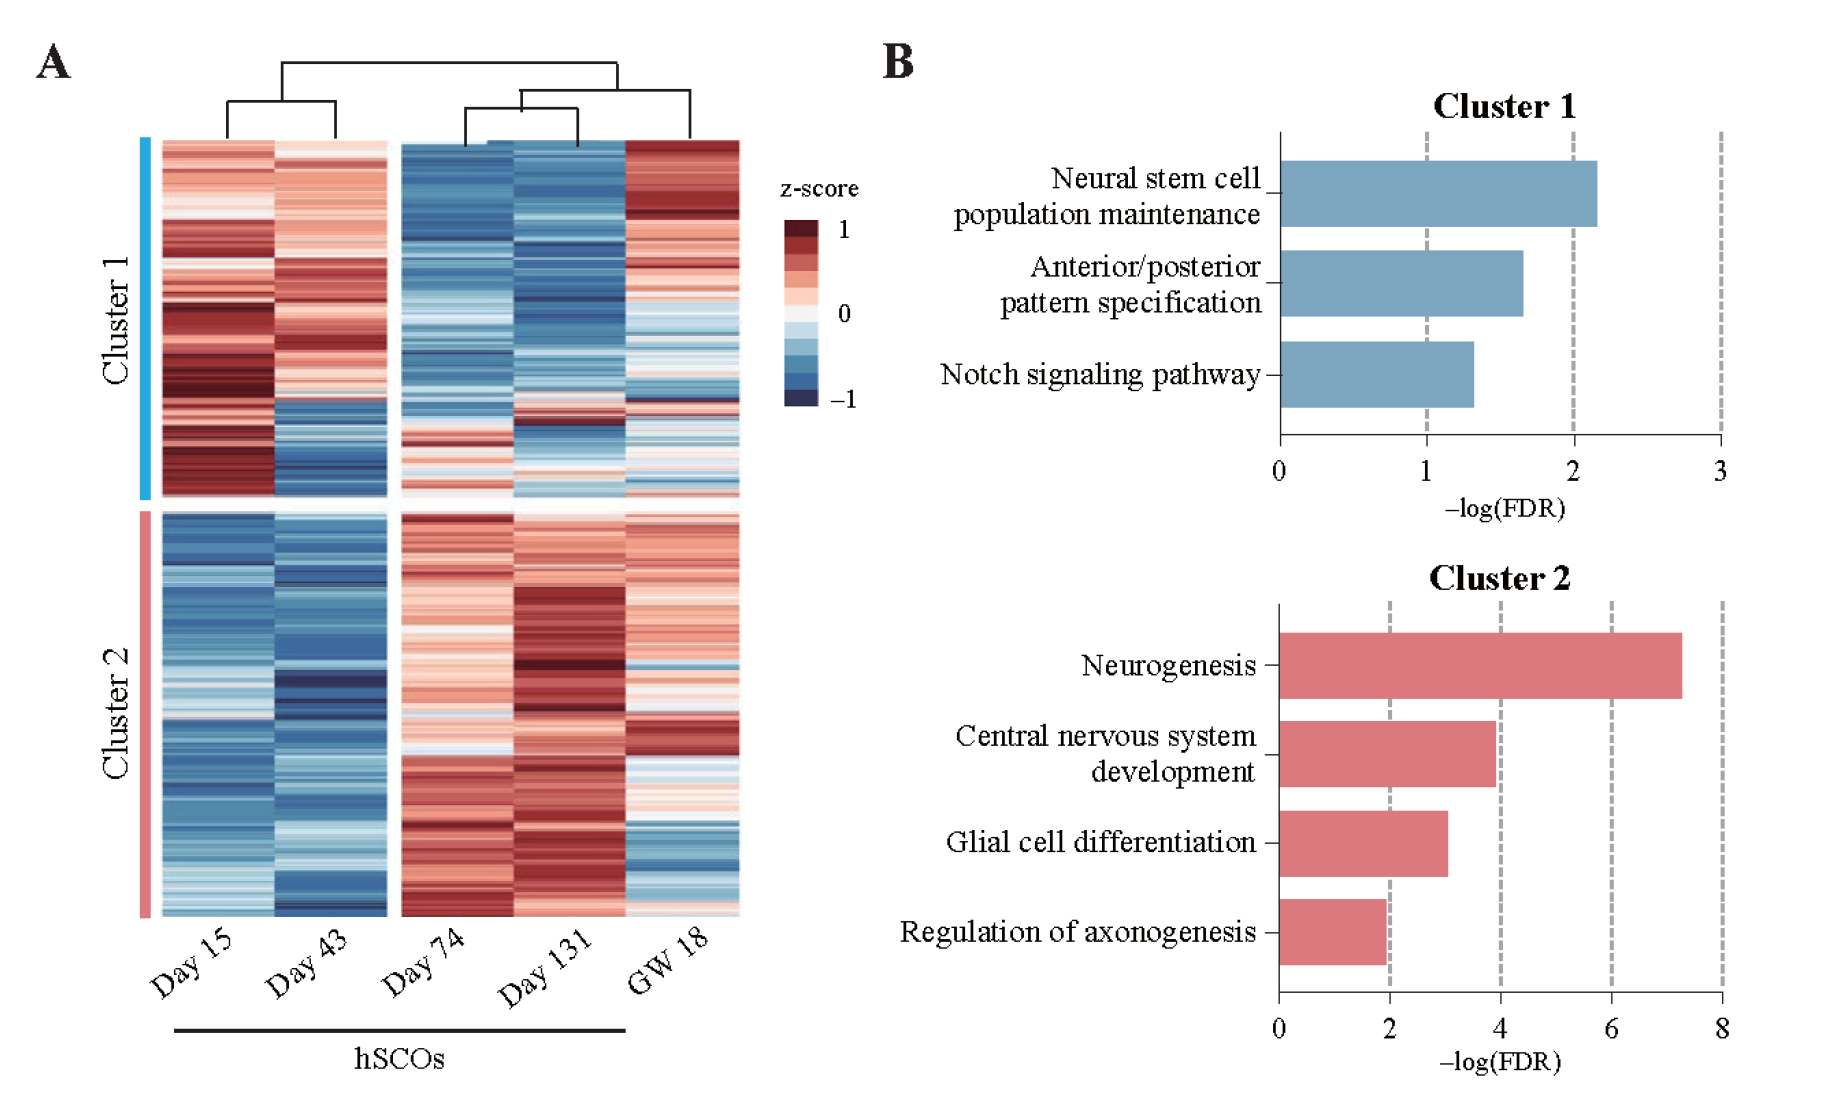 Figure 3. Microarray analysis on hSCO maturation: Neurons differentiate as the spinal cord develops in a human fetus.
(A) Heatmap of microarray data. It shows the expression of HVGs (top 5% of MAD, n = 1,556) from hSCOs matured to varying degrees and human fetal spinal cord tissue (GW=gestational week). (B) Significantly enriched GO term related to the biological process for gene clusters 1 and 2.
scRNA-seq Analysis and Double-Checking Strategy for the Determination of Accurate and Reliable Neuronal Cell Types in hSCOs
scRNA-seq was performed with 1-month organoid samples to better understand the distribution of neuronal cell types in mature hSCOs. Data were processed with a standard pipeline. After the data cleaning step, 18,365 genes across 11,038 cells were obtained for further analyses and grouped into 42 clusters. Before cell type assignment, an advanced method was developed to find the cell types more precisely. However, classifying cell types with the existing method determined by the expression of one or two known markers was challenging because neuron types classified by dorsoventral identity were determined by combining the progressive expression of several marker genes 10. Hence, the “double-checking strategy” was devised by adding a verification step to the existing method (Figure 4). First, the expression of well-known spinal cord neuron markers 10 was checked in our scRNA-seq data. Next, our data were mapped onto the reference data by using previously published in vivo data as a reference, and similarity between the cells of the reference and ours was calculated. The label of the reference cell with the highest correlation was transferred to the matching cells in our data. Cell type-assigned clusters were double-checked by the marker gene expression of the matched cell type. If a given cluster expresses the appropriate cell type marker, it retains the assigned cell type label; otherwise, the label is modified to a valid level.
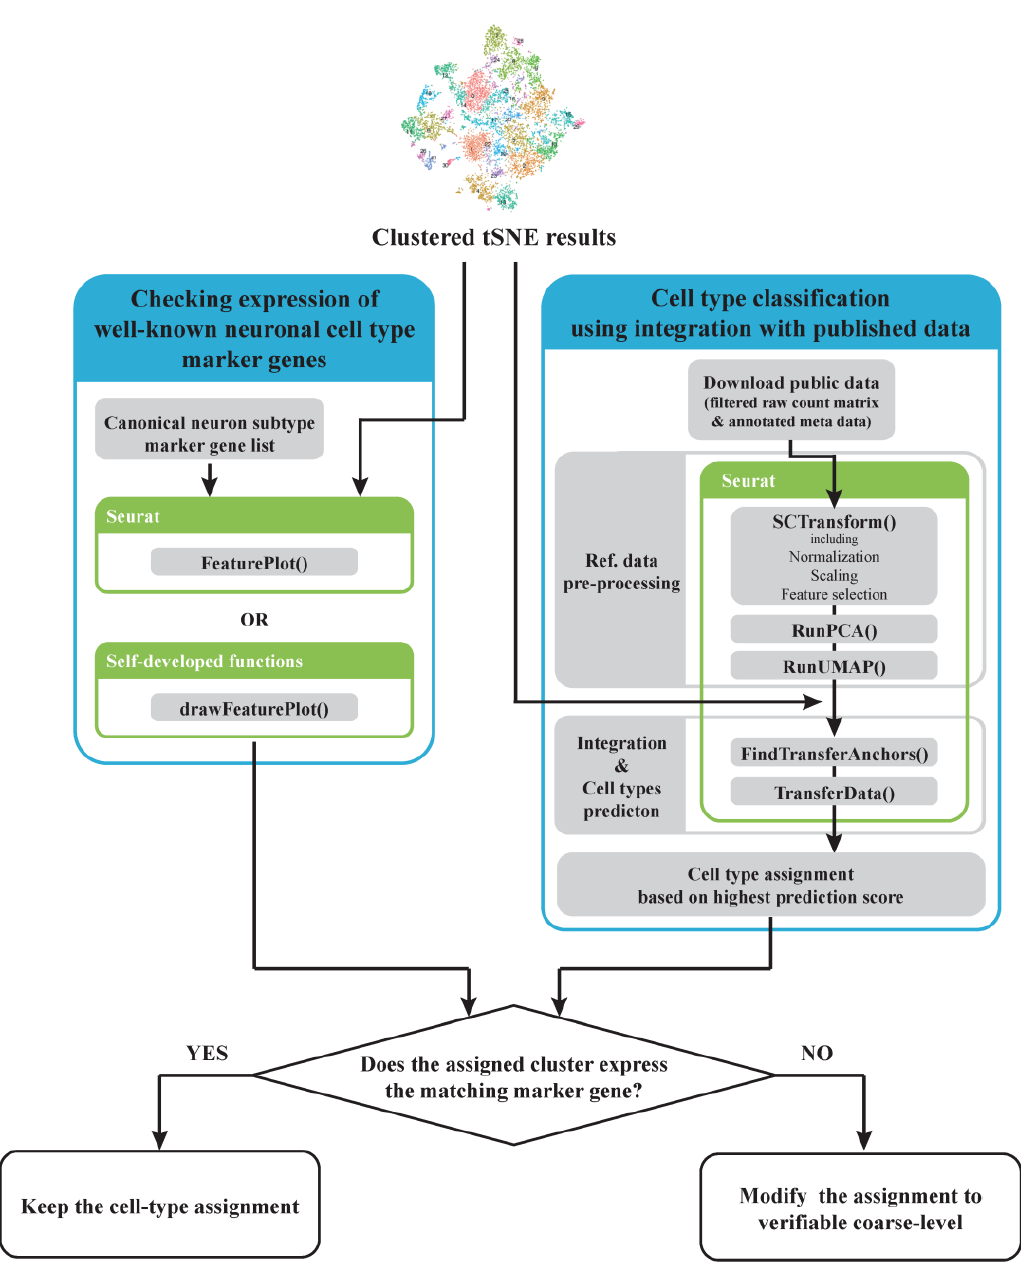 Figure 4. Outline of double-check strategy.
Two different methods were performed in parallel to obtain reliable cell type classification results and check whether both conditions were passed. Blue, green, and gray boxes indicate each classification analysis step, the tools used, and every analysis step and function used, respectively.
“Mouse Spinal Cord Atlas” data 11 were utilized as an in vivo reference data set to verify cell type assignment. They were obtained from the cervical and thoracic regions of the spinal cord in mouse embryos and assigned to the dorsoventral subclass cell types; thus, they were considered the best set to evaluate how well hSCOs replicated the actual spinal dorsal/ventral cell types. The downloaded Mouse Spinal Cord Atlas raw count data were processed with the same standard pipeline as ours to integrate reference and our data by first substituting mouse genes with homologous human genes. Subsequently, “FindTransferAnchors()” was performed to map our data on the reference, and cell type was predicted in terms of the similarity score of “TransferData()” based on reference annotation.
hSCOs Consist of Various Neuron Cell Types
Our 42 clusters were grouped into two large sets, and the expression of known markers revealed that these two groups represented progenitors and differentiated cells with neuronal fates, respectively (Figure 5). The detailed cell type was assessed in accordance with two criteria of neuron types: dorsoventral pattern and neurotransmitter subclass.
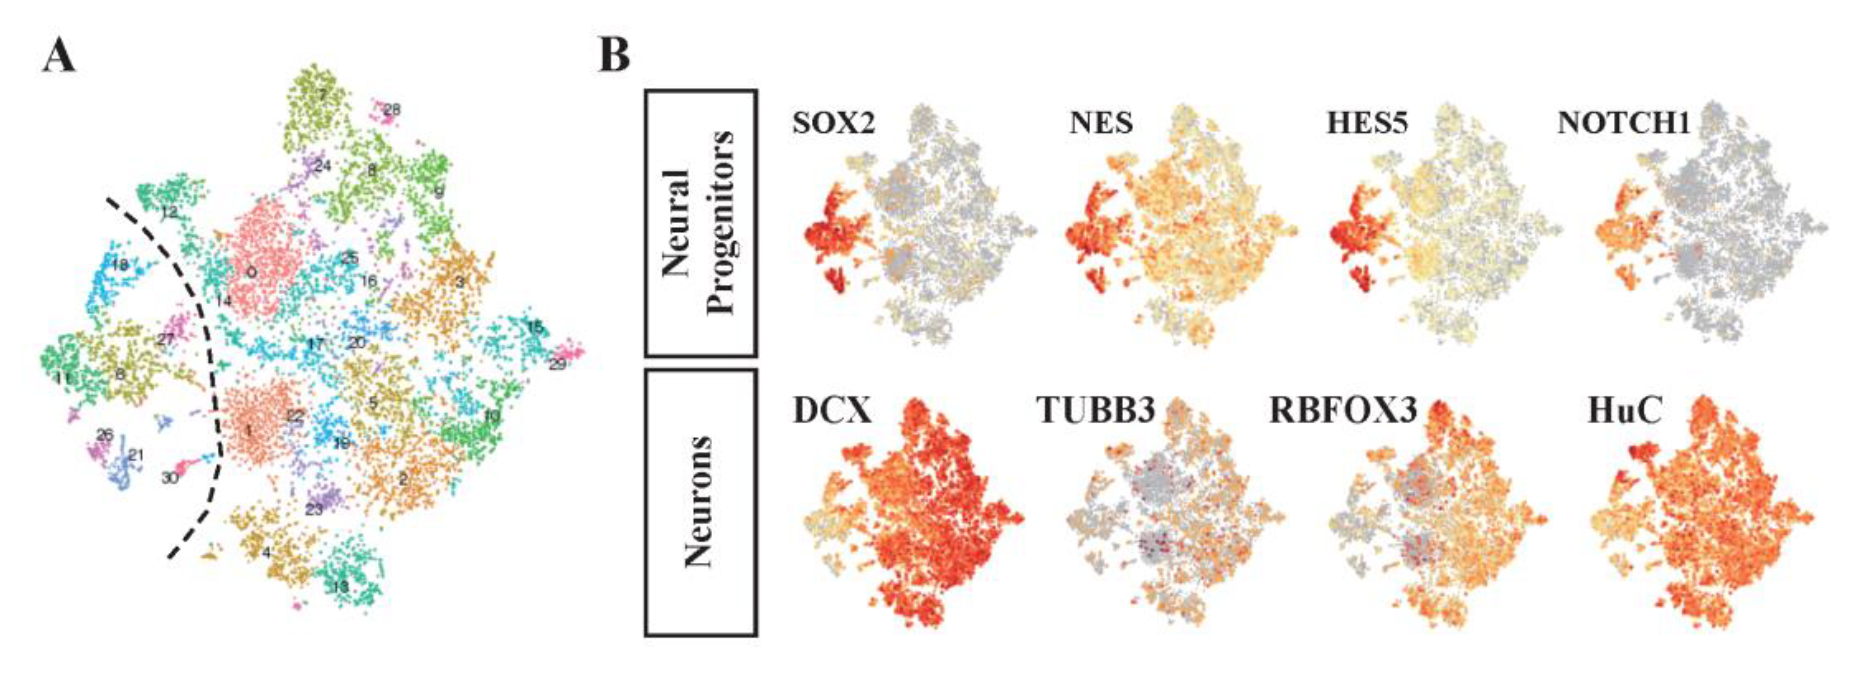 Figure 5. Single-cell clusters were classified mainly into groups of neural progenitors and differentiated neurons.
(A) Clustered cells were visualized by tSNE and largely divided in to two groups. (B) tSNE plot colored with the degree of marker gene expression representing a cell type. The left showing small cluster-expressed progenitor markers (SOX2) and the right showing large cluster-expressed neural cell markers (DCX).
The dorsal/ventral subclass was assigned using a previously developed strategy. First, single-cell clusters were annotated by the expression of markers, indicating the detailed dorsoventral types at each of the mitotic and postmitotic stages in spinal cord development following the snapshot diagram of spinal cord development by Alynick et al. 12 (Figure 6). It was well localized in the direction of maintaining large clusters’ characteristics that were identified before. The progenitor group expressed the markers of mitotic stage cell types, and the neuronal cell group expressed the markers of the postmitotic stage.
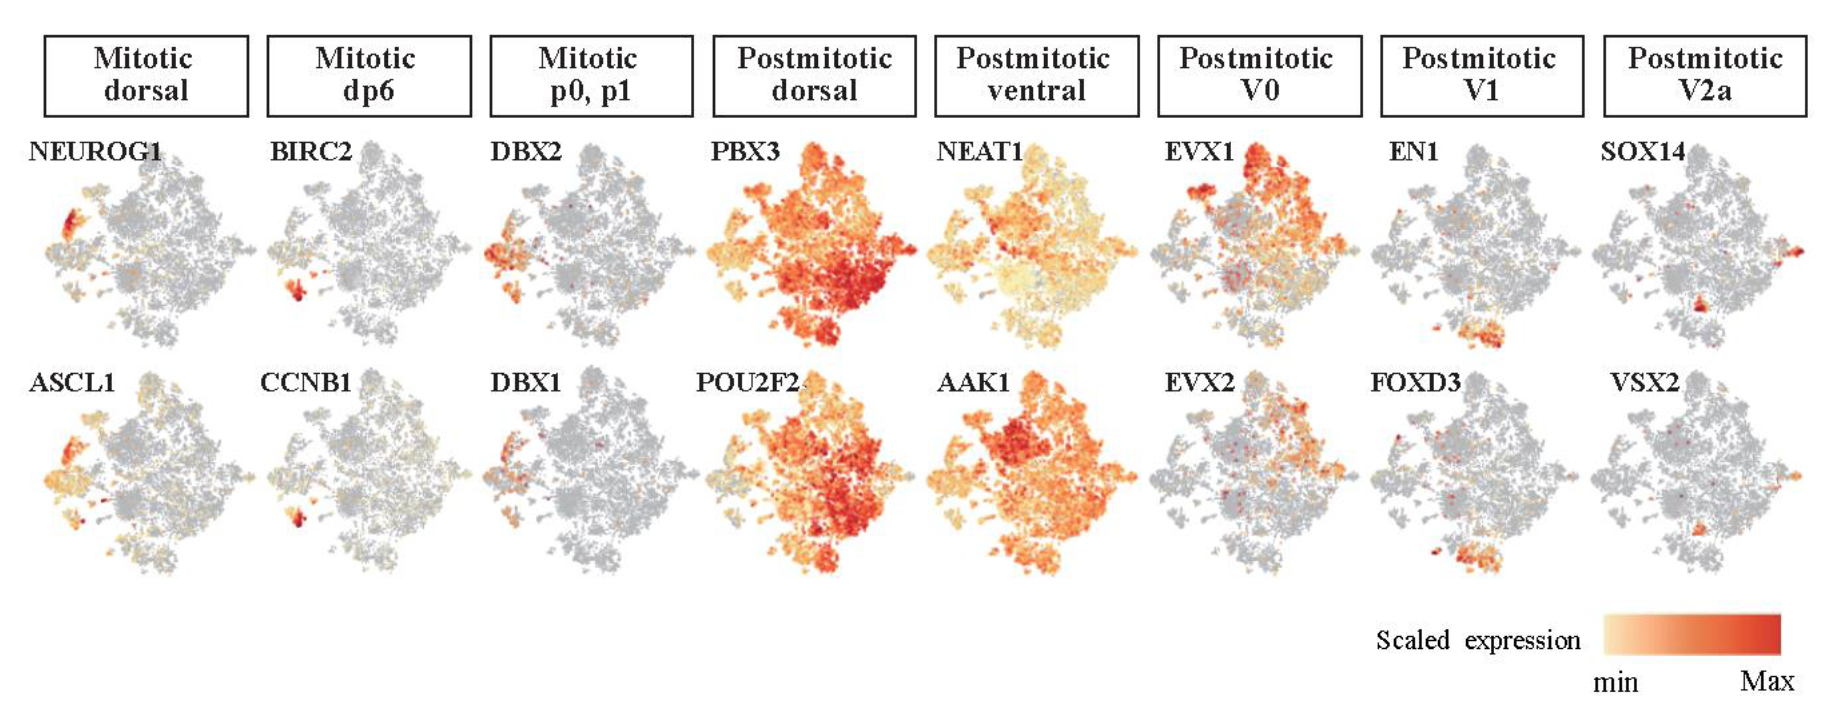 Figure 6. Each marker gene of the detailed dorsoventral types was expressed locally.
t-SNE plots showing the clustering of the detailed dorsoventral region-specific gene expression levels.
Next, data were integrated and labels were transferred to verify this classification. Reference data were also composed of two broad cell types, neurons, and progenitor cells, which were further divided into all kinds of the detailed dorsal/ventral cell types. The similarity score for each cell type was calculated across our population (Figure 7). The final cell type was assigned for each cluster by checking whether the marker of the predicted cell type was expressed (Figure 8).
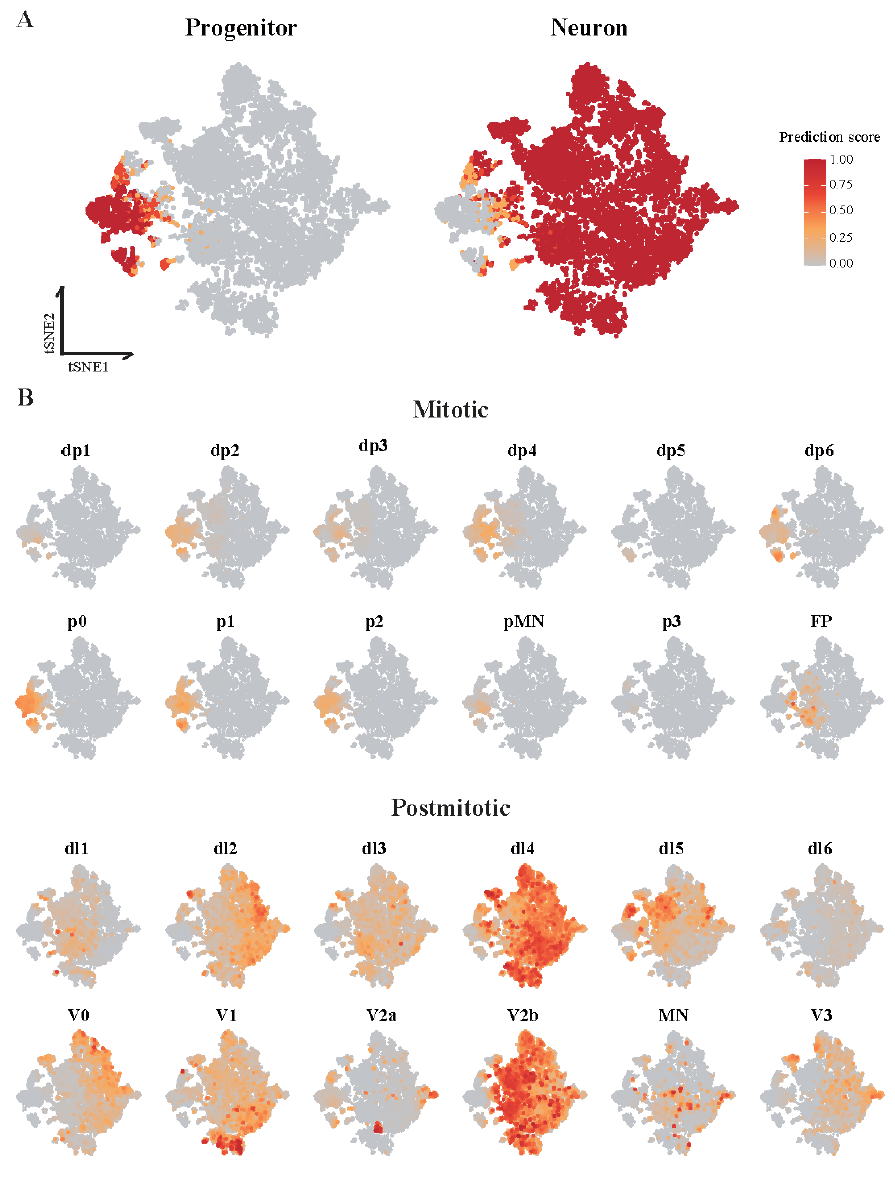 Figure 7. Prediction scores of each cell type were obtained by label transfer.
(A) t-SNE plots showing the predicted clusters for progenitor and neuron cells. Each spot (single cell) had a prediction score for each cell type with values between 0 and 1. (B) t-SNE plots showing the prediction scores for dorsal/ventral subclass cell types. The color scale is the same as in Panel (A).
The analysis revealed that hSCOs contained various dorsal/ventral cells. The cells of mitotic pd6, p0, and p1 sections were identified in progenitor clusters and postmitotic V0, V1, and V2a section cells were found in neuron clusters. Since each section of the mitotic stage evolves into a section of the postmitotic stage, hSCOs efficiently replicated these cell types. However, several postmitotic dorsal clusters could not be divided into more detailed types. They were predicted to be dl4, but they expressed only the early postmitotic dorsal marker and not dl4-specific markers. In the case of the cluster annotated with postmitotic ventral, it was expected to be a v2b type, but it did not express any v2b markers except the broad ventral marker.
After cell classification, the results were reviewed to verify if the annotations matched the known information. The strategy worked well as confirmed through the expression level of cell type-specific markers for each annotated cluster and the ratio of these marker-positive cells (Figure 8B). In an unbiased manner, DEGs were selected for each classified cluster, and the top 10 genes with significant fold changes compared with other clusters reflected the existing knowledge (Figure 9).
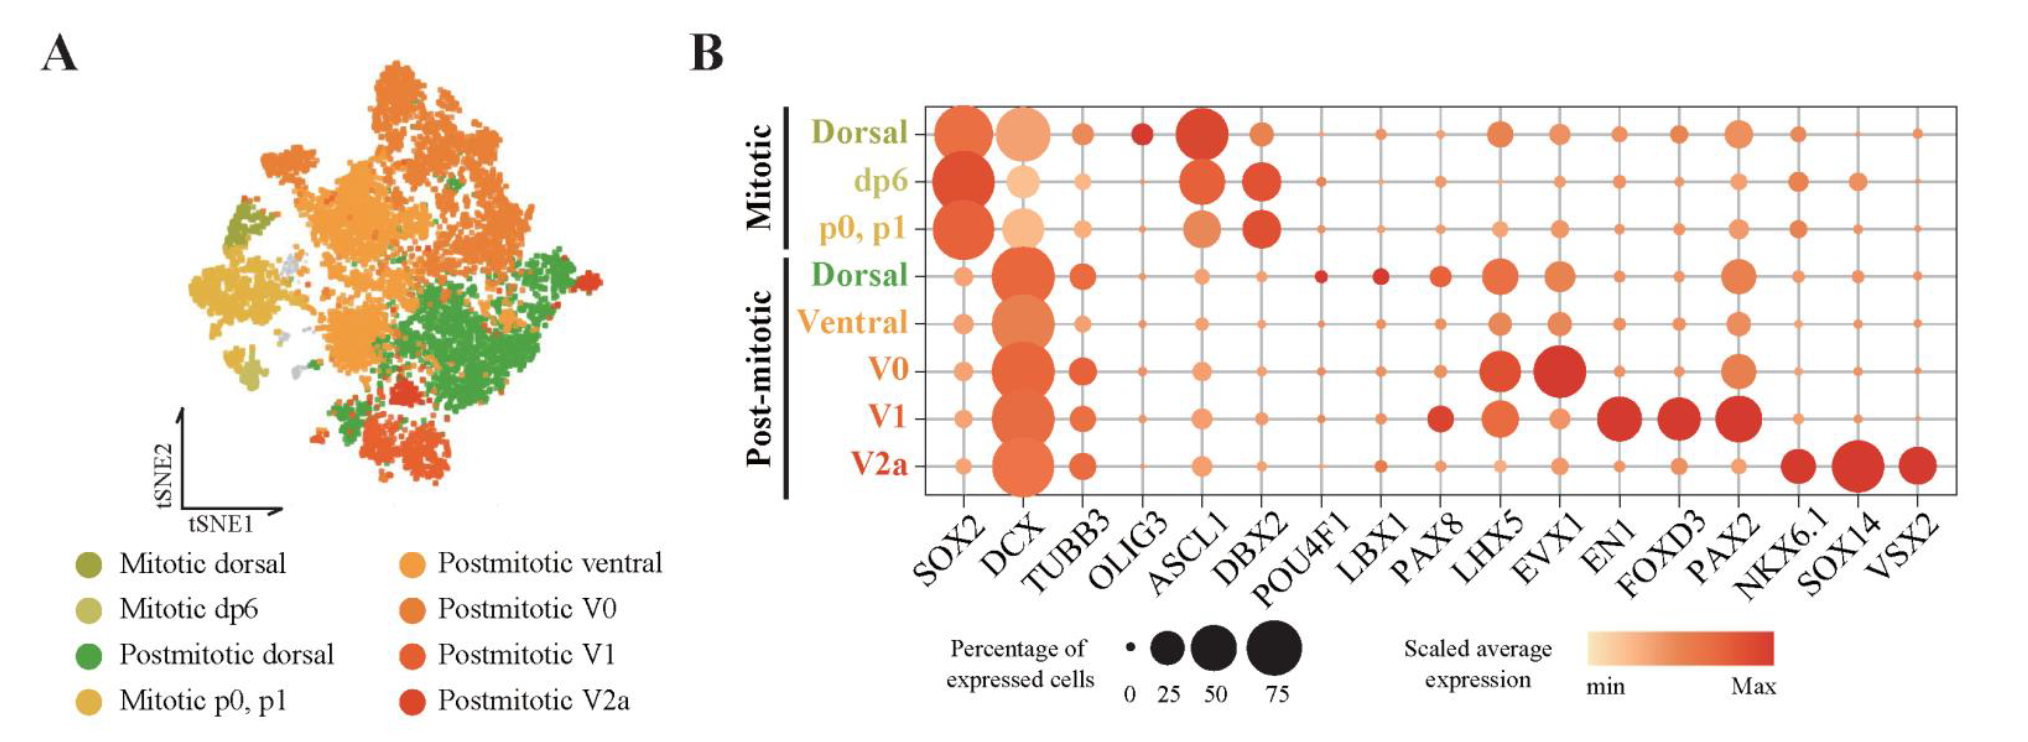 Figure 8. single-cell clusters were classified as dorsoventral cell types
(A) tSNE plot colored by annotated dorsoventral cell types. (B) Gene expression profiles of dorsoventral-specific markers. The size and color of the circles represent the percentage of expressed cells and the average value of gene expression, respectively
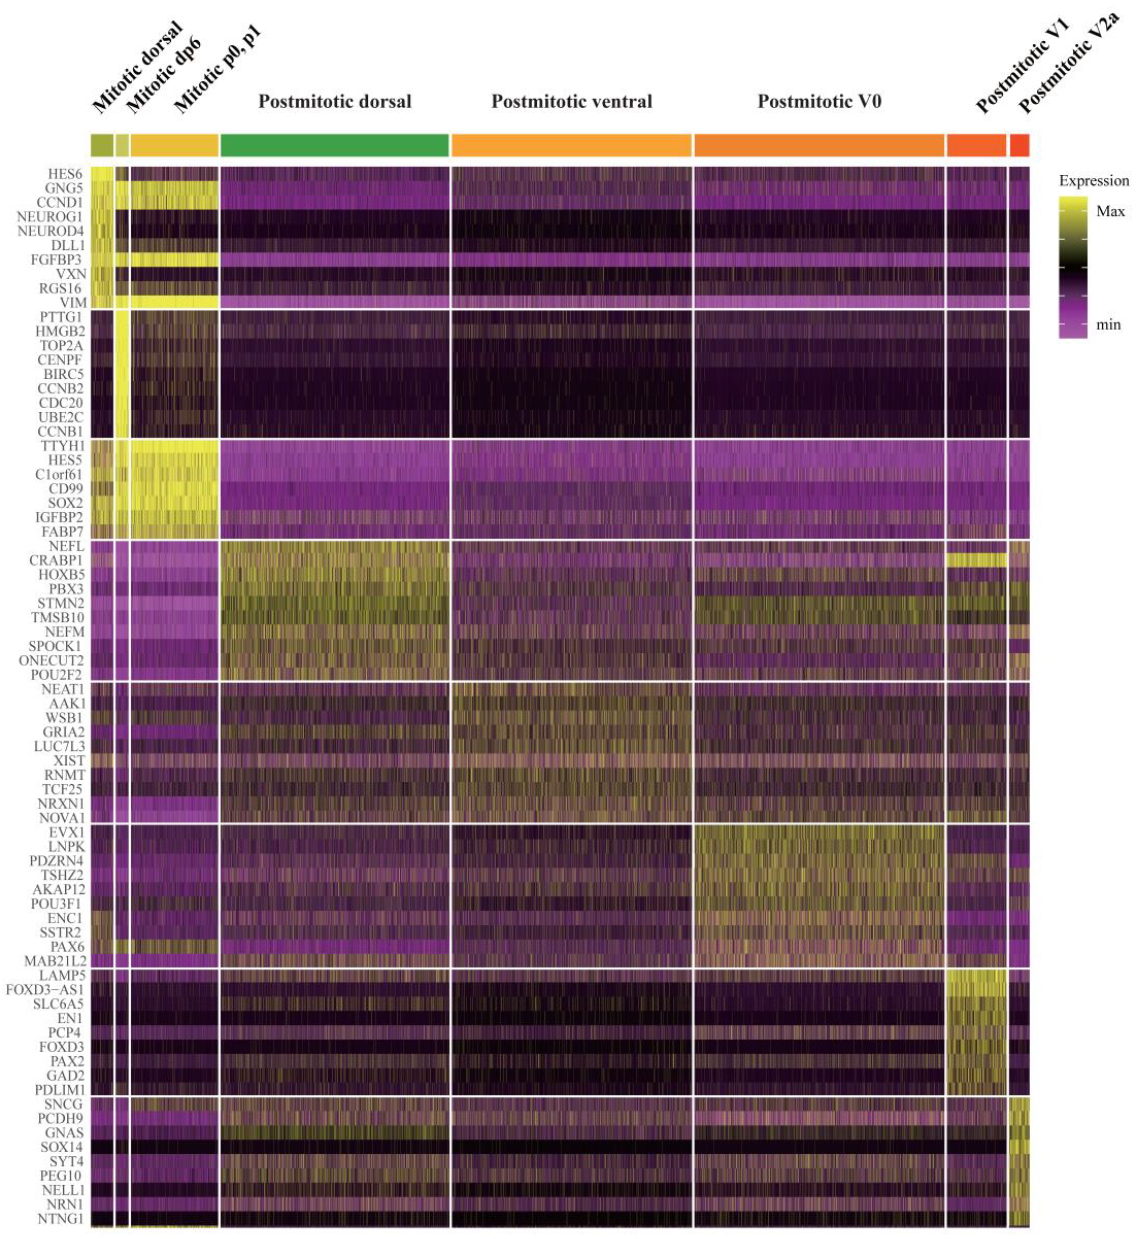 Figure 9. Heatmap expression of the top 10 cluster marker genes for dorsal/ventral subclass cell type clusters
The heatmap color indicates the scaled gene expression levels in scRNA-seq data.
The existence of cell types confirmed through data analysis was also experimentally verified by domain-specific marker staining (Figure 10A). However, the regional dorsoventral patterning was not observed. Moreover, HOX family was expressed in hSCOs, indicating a posterior identity, but anteroposterior patterning was not observed (Figure 10B, C).
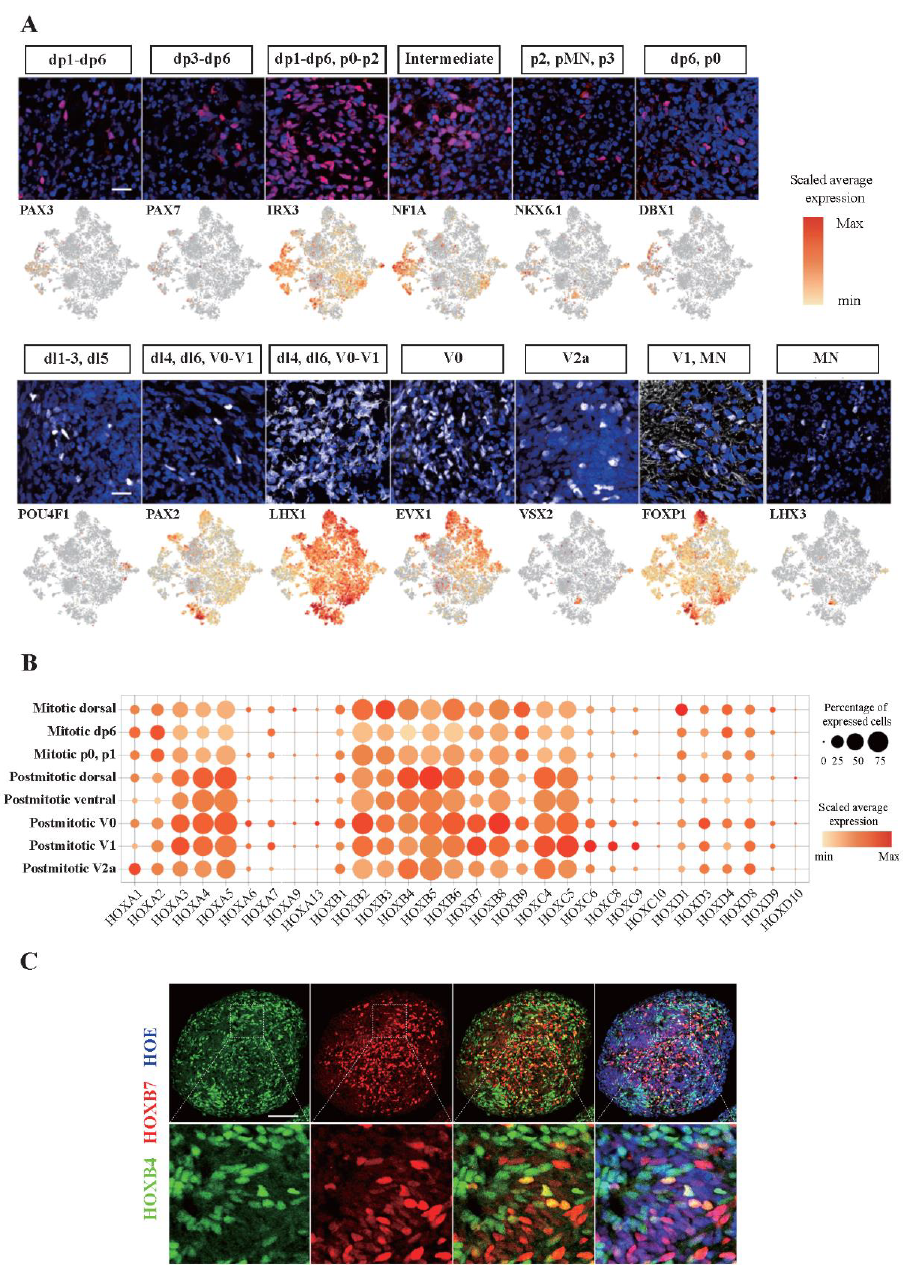 Figure 10. Various cell types identified in scRNA-seq data were verified through immunostaining analysis.
These domain-specific markers were rather scattered in the hSCOs. Scale bars, 20 μm.
Cell types were classified again in the same single cell cluster based on neurotransmitter type. Neurotransmitter types can be more clearly distinguished than dorsoventral ones because signaling molecules secreted by each cell type are limited. As a result, five major neuron types were identified: neural progenitors, glutamatergic neurons, glutamatergic/cholinergic neurons, GABAergic neurons, and GABA/glycinergic neurons (Figure 11).
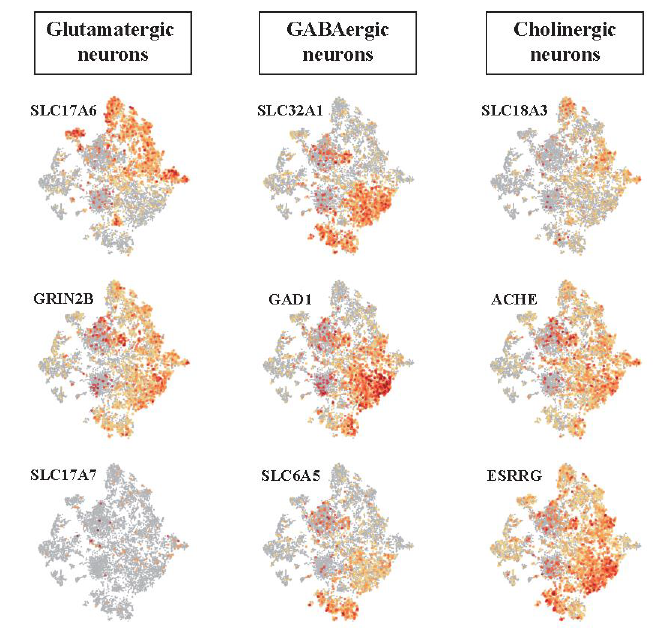 Figure 11. Neurotransmitter type neurons were identified by known marker gene expression.
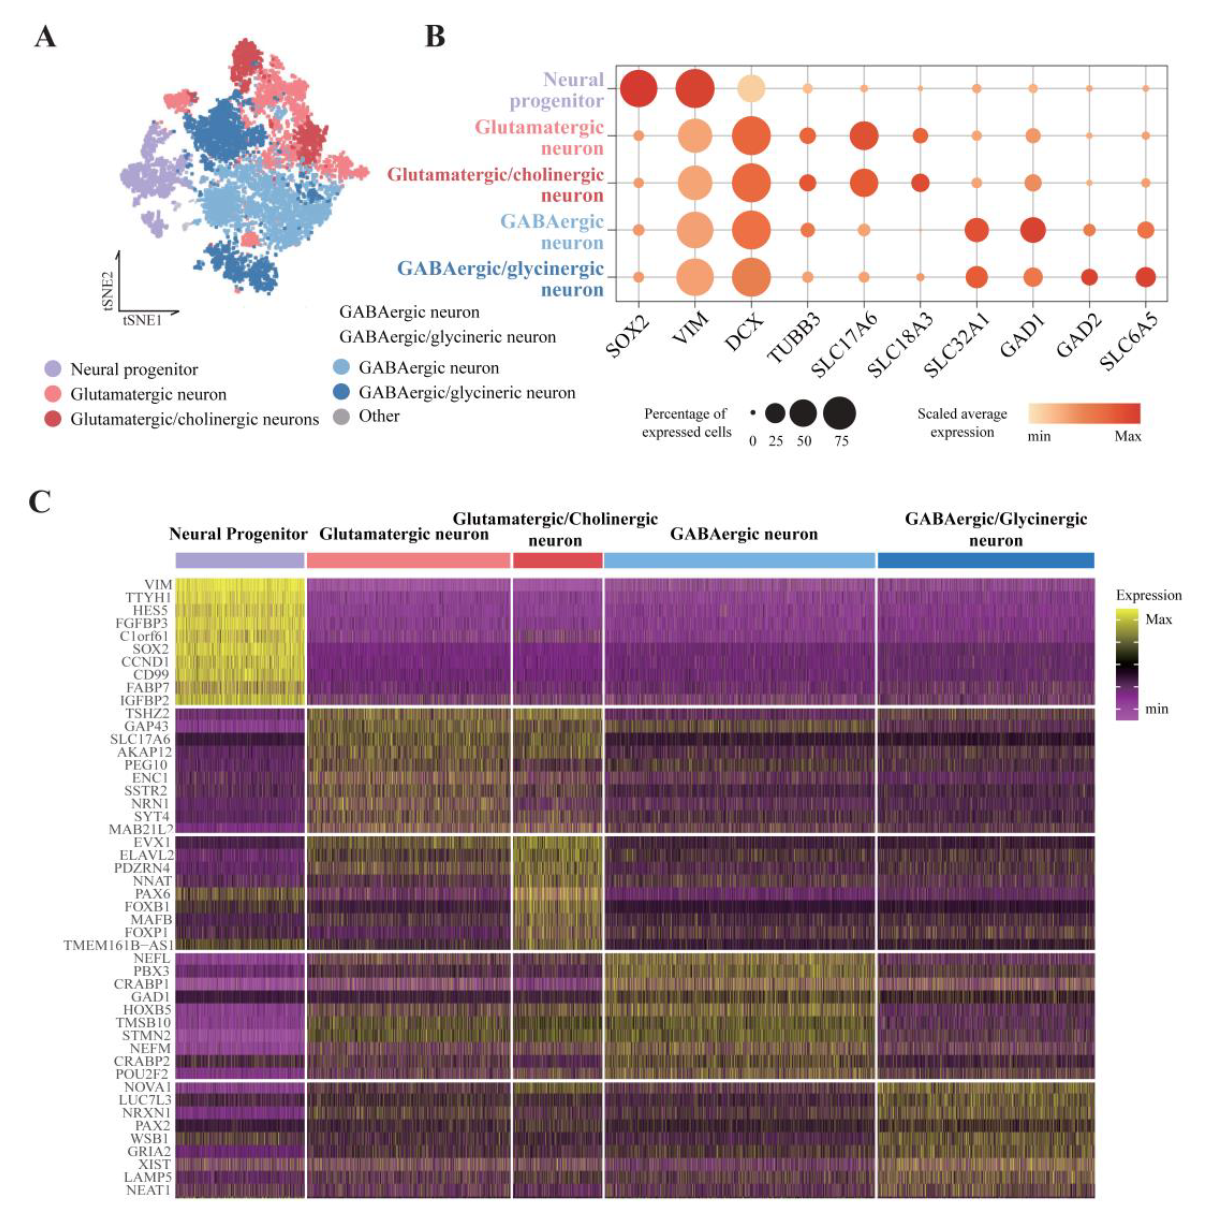 Figure 12. Classification result of single-cell cluster based on neurotransmitter types.
(A) tSNE plot colored by annotated neurotransmitter cell types. (B) Gene expression profiles of neurotransmitters. The size and color of circles represent the percentage of expressed cells and the average value of gene expression, respectively. (C) Heatmap expression of the top 10 cluster marker genes for neurotransmitter cell type clusters. The heatmap color indicates the scaled gene expression levels in scRNA-seq data.
Discussion
Here, I introduced two different new protocols: a method for generating hSCOs that demonstrates neurulation-like morphogenesis and a cell type assignment strategy for conducting single-cell analysis through the addition of a cell type prediction step involving similarity with reference data.
Most of the previous organoid models exhibited neural follicle or cyst expansion similar to 2D neural rosette formation, which is different from neural tube formation in vivo. A neural tube is an important tissue that develops into the CNS and is created by a series of processes called neurulation. This process could be mimicked by 3D-cultured hSCOs; after this morphogenesis step, spinal cord neurons were differentiated within this organoid. The applicability and reproducability of hSCOs were proven by immunohistochemistry and transcriptomic data analysis. This method would help explore the early development of the spinal cord and related diseases such as NTDs.
In single-cell analysis, advanced cell type assignment has made a breakthrough in the classification of differentiated cells because of gradual gene distribution. Identifying cell types in single-cell data of neuronal organoids has only depended on the presence of one or two marker genes. This developed method works by comparing the expression patterns of thousands of genes for each cell type to calculate similarities between annotated reference data, which are useful for developing neuron types that cannot be annotated with several genes. Although this strategy provided more reliable results and helped make clear decisions, some results did not reveal the most detailed type. Postmitotic dorsal clusters could not be divided into more detailed types. Because broad dorsal markers of the early postmitotic stage were expressed, markers that distinguished the detailed sections were not expressed at all, and several detailed dorsal types were mixed and predicted. These results suggested that our single-cell data indicated the organoid properties at this point rather than a matter of the performance of the method. Neurons may still be differentiated in hSCOs in 1 month, and markers that divide the detailed types are expressed later according to the developmental stage of the spinal cord. Similarly, postmitotic ventral clusters were predicted to be v2b with high prediction scores, but the presence of regional markers was not confirmed. One reason is that most markers of the v2b region are transcription factors (TF), such as SCL, GATA2, and GATA3. A TF quickly disappears after regulation; consequently, TF cannot be easily detected through transcriptomic analysis unless the time point is captured. Therefore, these clusters with a high probability of being v2b suggested that the novel markers are of a v2b type, not a TF.
Assignment results were double-checked with known marker gene expression, but because of the current lack of adequate in vivo data, only one reference was used, thus leading to biased assay results. The popularity of sc-seq continues to generate large amounts of data; therefore, the later integration of multiple reference data can increase the accuracy of the method developed in this project.
Reference
-
Smith, J.L. and G.C. Schoenwolf, Neurulation: coming to closure. Trends in neurosciences, 1997. 20(11): p. 510-517. ↩
-
Lu, D.C., T. Niu, and W.A. Alaynick, Molecular and cellular development of spinal cord locomotor circuitry. Frontiers in molecular neuroscience, 2015. 8: p. 25. ↩
-
Jankowska, E., Spinal interneuronal systems: identification, multifunctional character and reconfigurations in mammals. The Journal of physiology, 2001. 533(1): p. 31-40. ↩
-
Zheng, Y., et al., Advances in neural organoid systems and their application in neurotoxicity testing of environmental chemicals. Genes and Environment, 2021. 43(1): p. 1-12. ↩
-
Warmflash, A., et al., A method to recapitulate early embryonic spatial patterning in human embryonic stem cells. Nature Methods, 2014. 11(8): p. 847-854.
Haremaki, T., et al., Self-organizing neuruloids model developmental aspects of Huntington’s disease in the ectodermal compartment. Nature Biotechnology, 2019. 37(10): p. 1198-1208.
Moris, N., et al., An in vitro model of early anteroposterior organization during human development. Nature, 2020. 582(7812): p. 410-415.
Kim, J., B.-K. Koo, and J.A. Knoblich, Human organoids: model systems for human biology and medicine. Nature Reviews Molecular Cell Biology, 2020. 21(10): p. 571-584 ↩ -
Meinhardt, A., et al., 3D reconstitution of the patterned neural tube from embryonic stem cells. Stem cell reports, 2014. 3(6): p. 987-999
Ogura, T., et al., Three-dimensional induction of dorsal, intermediate and ventral spinal cord tissues from human pluripotent stem cells. Development, 2018. 145(16): p. dev162214.
Hor, J.H., et al., Cell cycle inhibitors protect motor neurons in an organoid model of Spinal Muscular Atrophy. Cell death & disease, 2018. 9(11): p. 1-12.
Martins, J.-M.F., et al., Self-organizing 3D human trunk neuromuscular organoids. Cell stem cell, 2020. 26(2): p. 172-186. e6.
Rifes, P., et al., Modeling neural tube development by differentiation of human embryonic stem cells in a microfluidic WNT gradient. Nature Biotechnology, 2020. 38(11): p. 1265-1273. ↩ -
Fiddes, I.T., et al., Human-specific NOTCH2NL genes affect notch signaling and cortical neurogenesis. Cell, 2018. 173(6): p. 1356-1369. e22.
Pollen, A.A., et al., Establishing cerebral organoids as models of human-specific brain evolution. Cell, 2019. 176(4): p. 743-756. e17.
Velasco, S., et al., Individual brain organoids reproducibly form cell diversity of the human cerebral cortex. Nature, 2019. 570(7762): p. 523-527. ↩ -
Quadrato, G., et al., Cell diversity and network dynamics in photosensitive human brain organoids. Nature, 2017. 545(7652): p. 48-53. ↩
-
Denham, M., et al., Multipotent caudal neural progenitors derived from human pluripotent stem cells that give rise to lineages of the central and peripheral nervous system. Stem cells, 2015. 33(6): p. 1759-1770 ↩ ↩2
-
Anderson, M.J., et al., TCreERT2, a transgenic mouse line for temporal control of Cre-mediated recombination in lineages emerging from the primitive streak or tail bud. PloS one, 2013. 8(4): p. e62479. ↩ ↩2 ↩3
-
Delile, J., et al., Single cell transcriptomics reveals spatial and temporal dynamics of gene expression in the developing mouse spinal cord. Development, 2019. 146(12): p. dev173807 ↩
-
Alaynick, W.A., T.M. Jessell, and S.L. Pfaff, SnapShot: spinal cord development. Cell, 2011. 146(1): p. 178. ↩
